Data Records
Data Overview
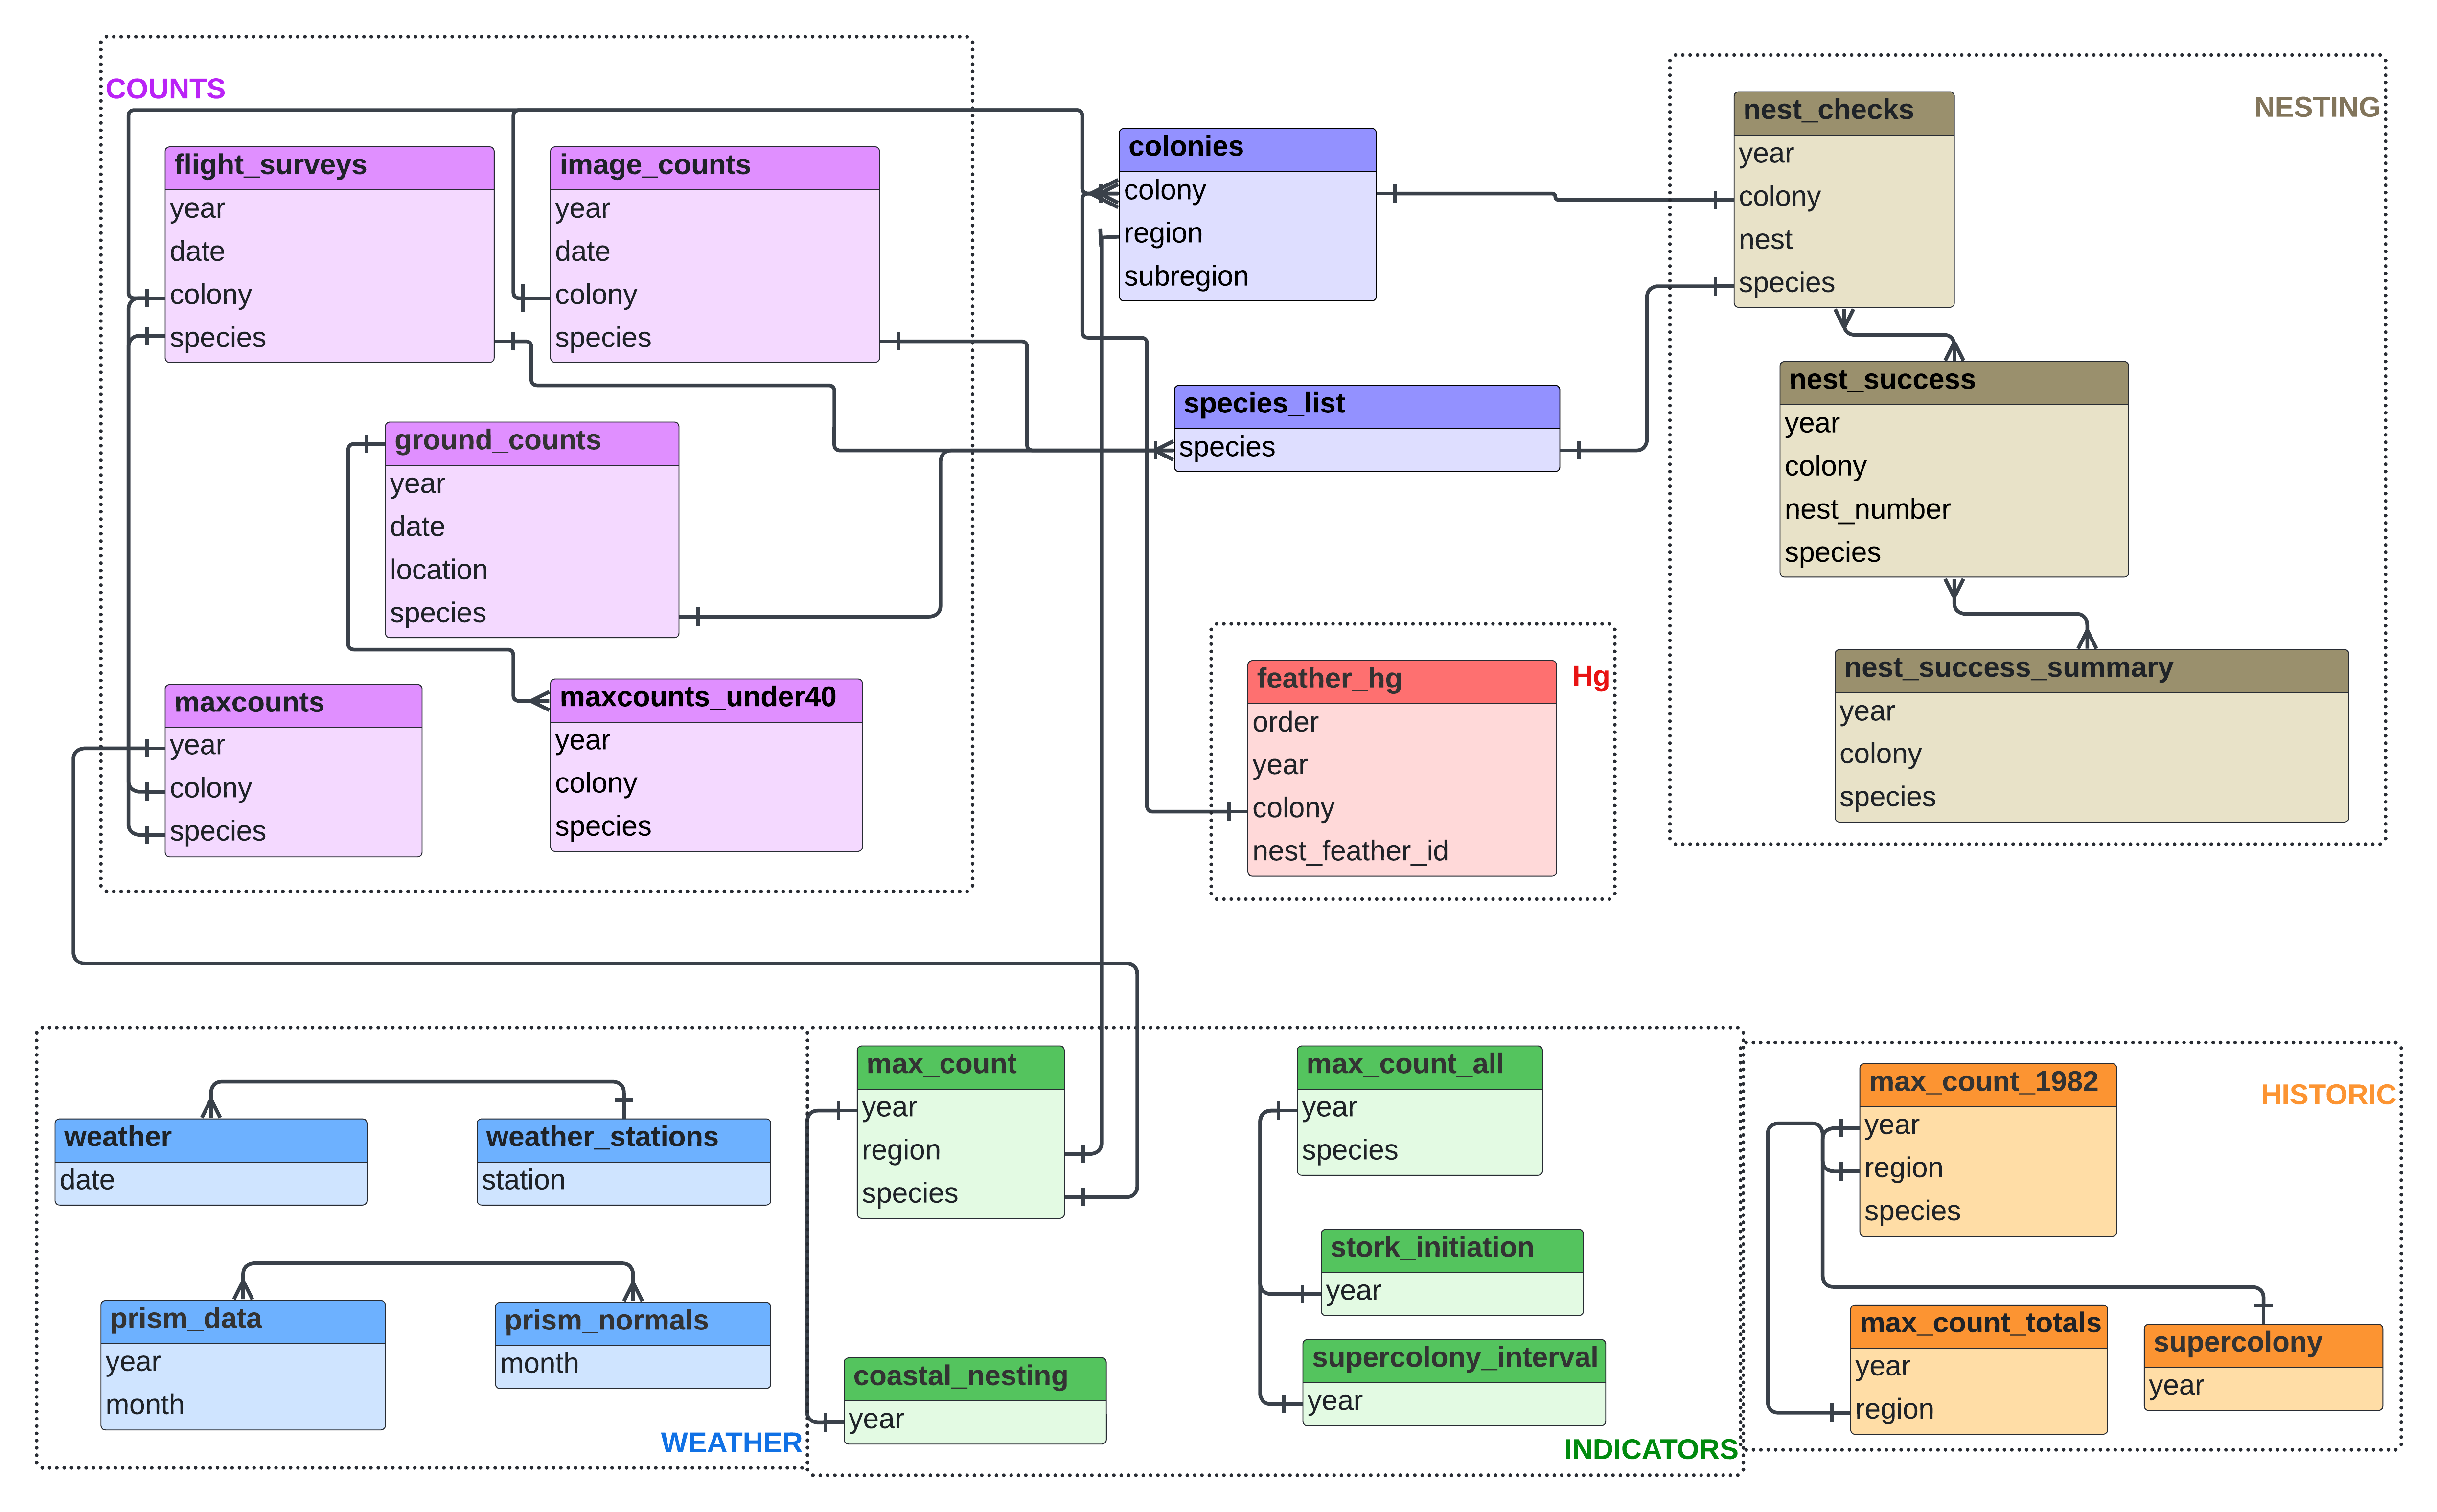
Data are maintained in a git repository, and archived on Zenodo. The data contain 23 tables in 7 directories (Figure 3). Each directory contains a README file describing its tables. Additional directories contain cleaning scripts and tests used in data QA/QC (see data validation section below).
Site and Methods
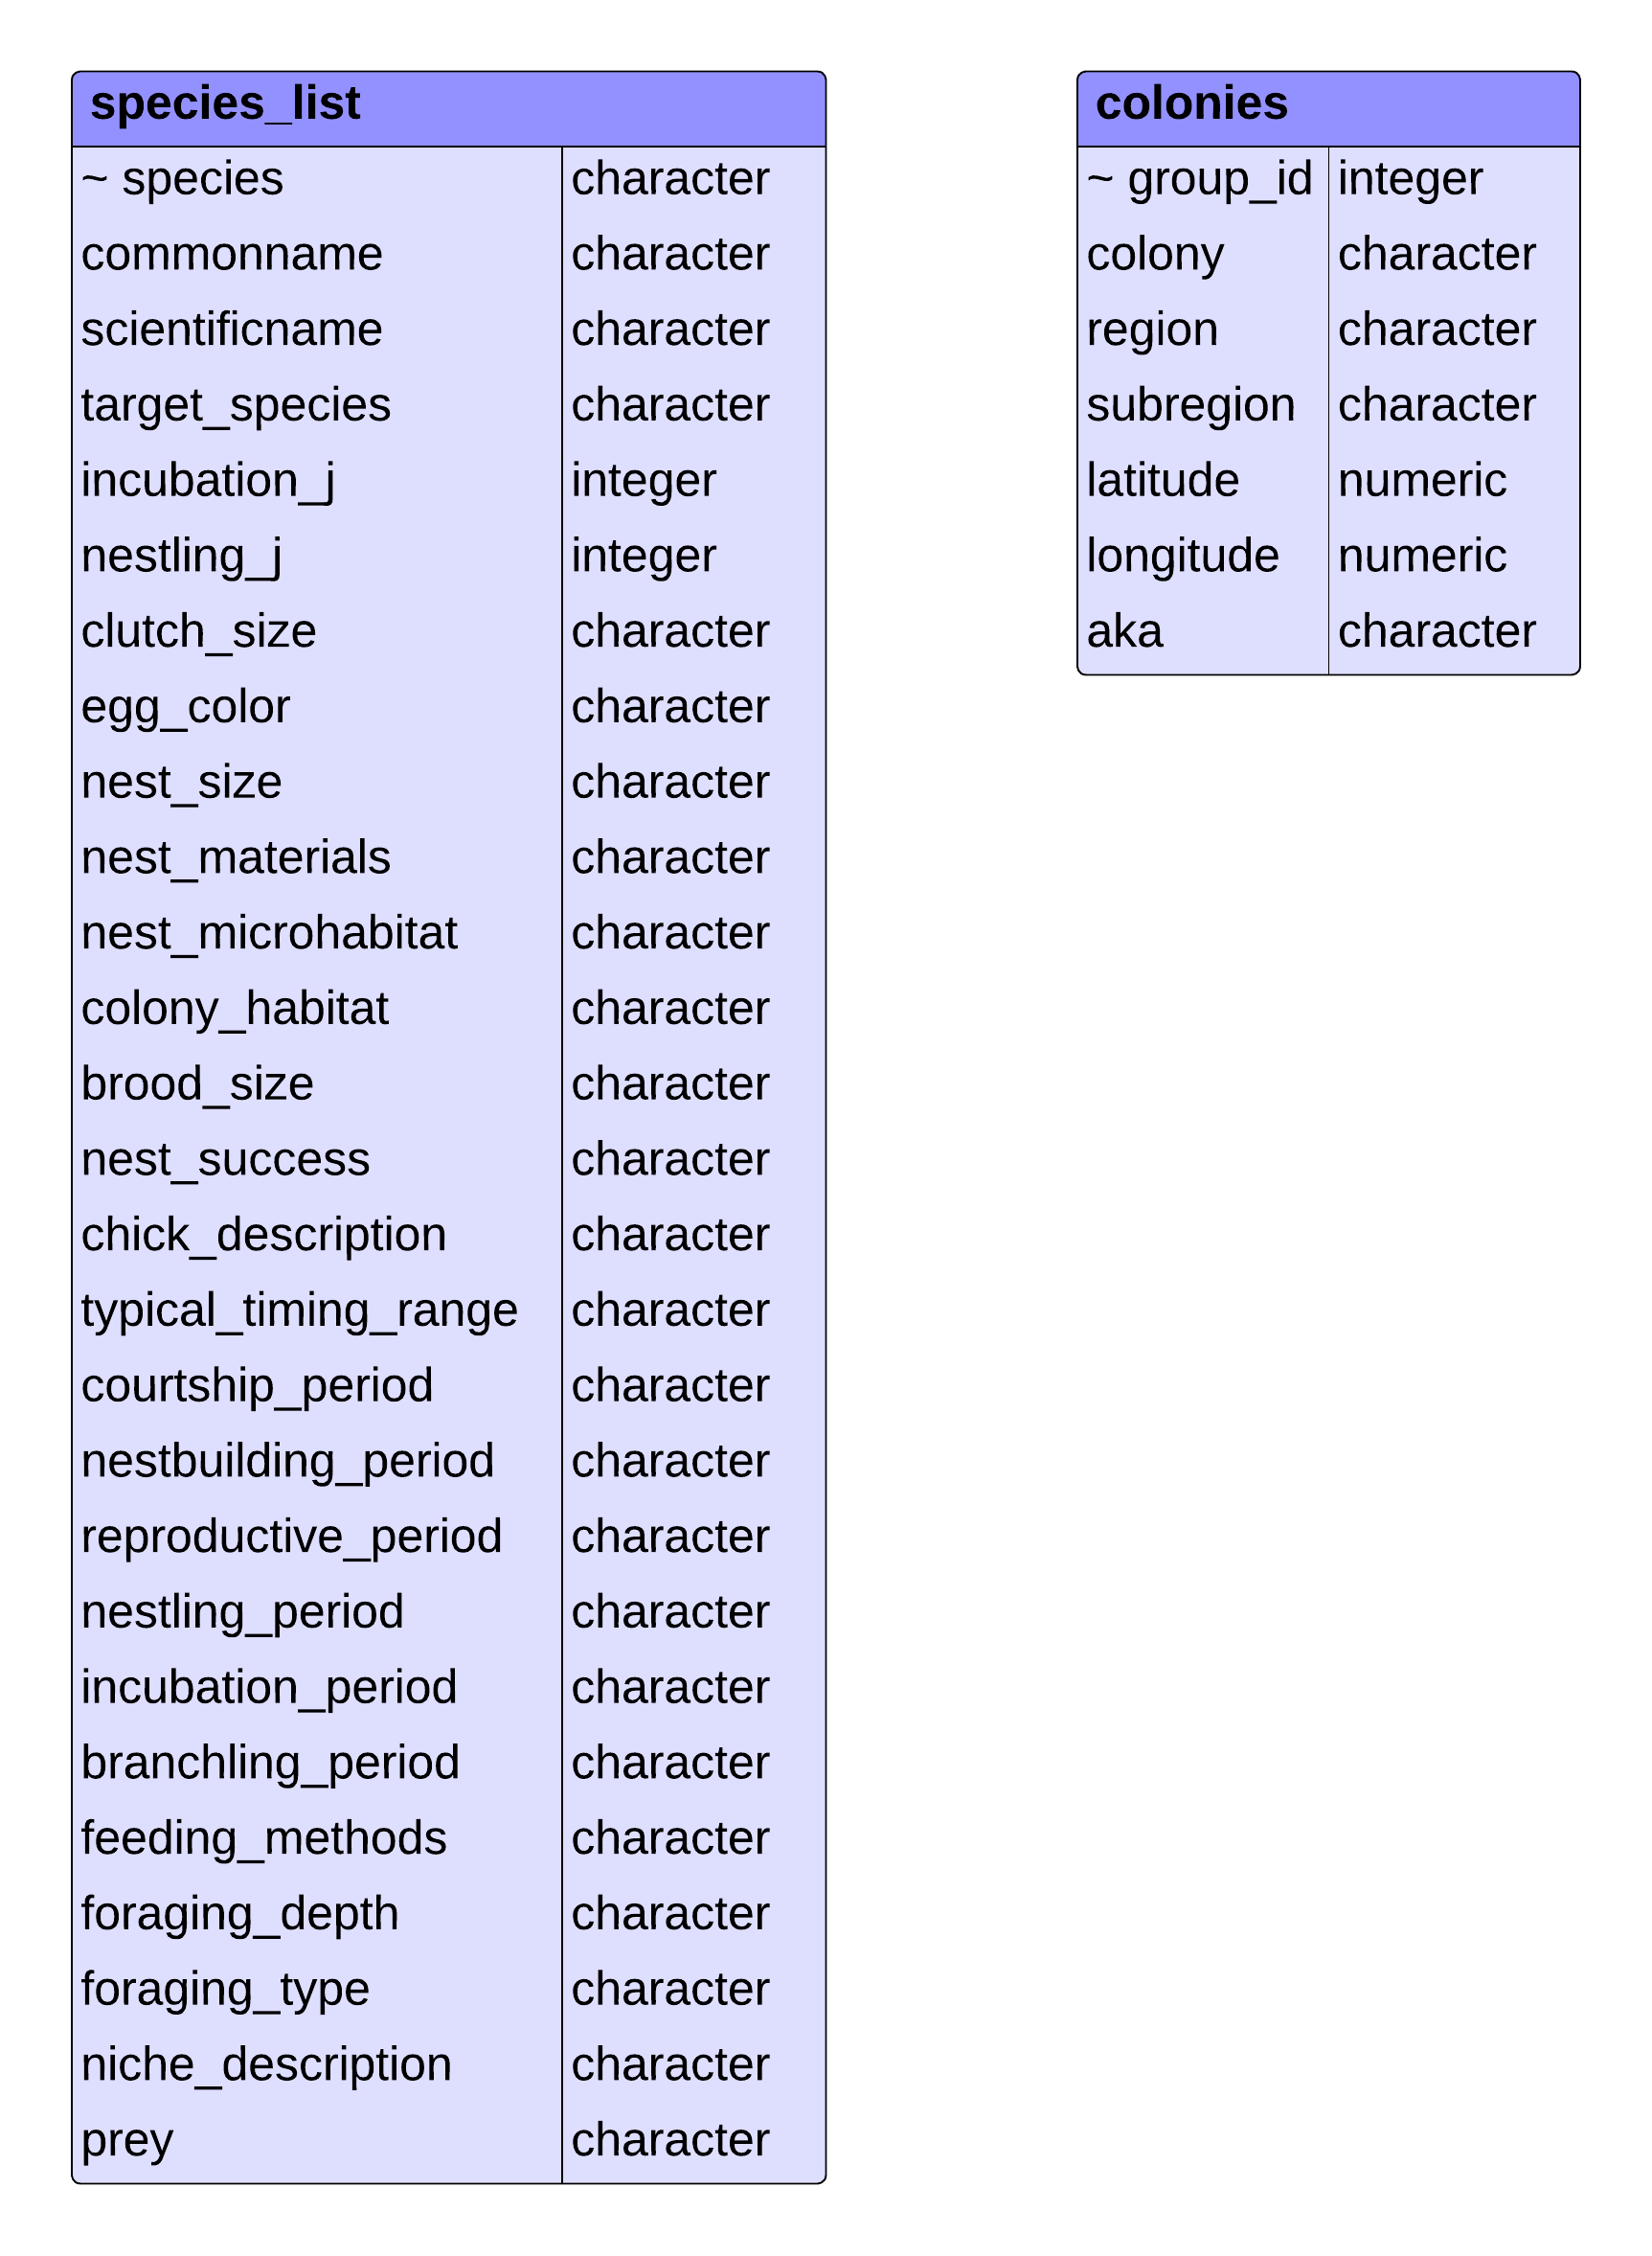
These files provide site-level information about the data. Species phenology is taken from the literature. Official colony locations are determined by the time series of counts. Any tree island with aerial observations is assigned an official colony name. The colony shapefile is determined by the cluster of observed count locations around the tree island. Regions are defined by legal designations (water conservation areas - WCAs, public lands - National/state parks). Subregions are designed to encompass distinct water management areas within a region.
- species_list.csv: Includes species phenology, foraging behavior and nest attributes. Non-target species are noted but are not systematically counted.
- colonies.csv: Official names and locations of all colonies that have reported counts and/or nests.
- Spatial Data: This directory also contains spatial polygons defining the regions, subregions and colonies within the study area. Data are provided as shapefiles, GeoJSON and Geopackage files.
Counts
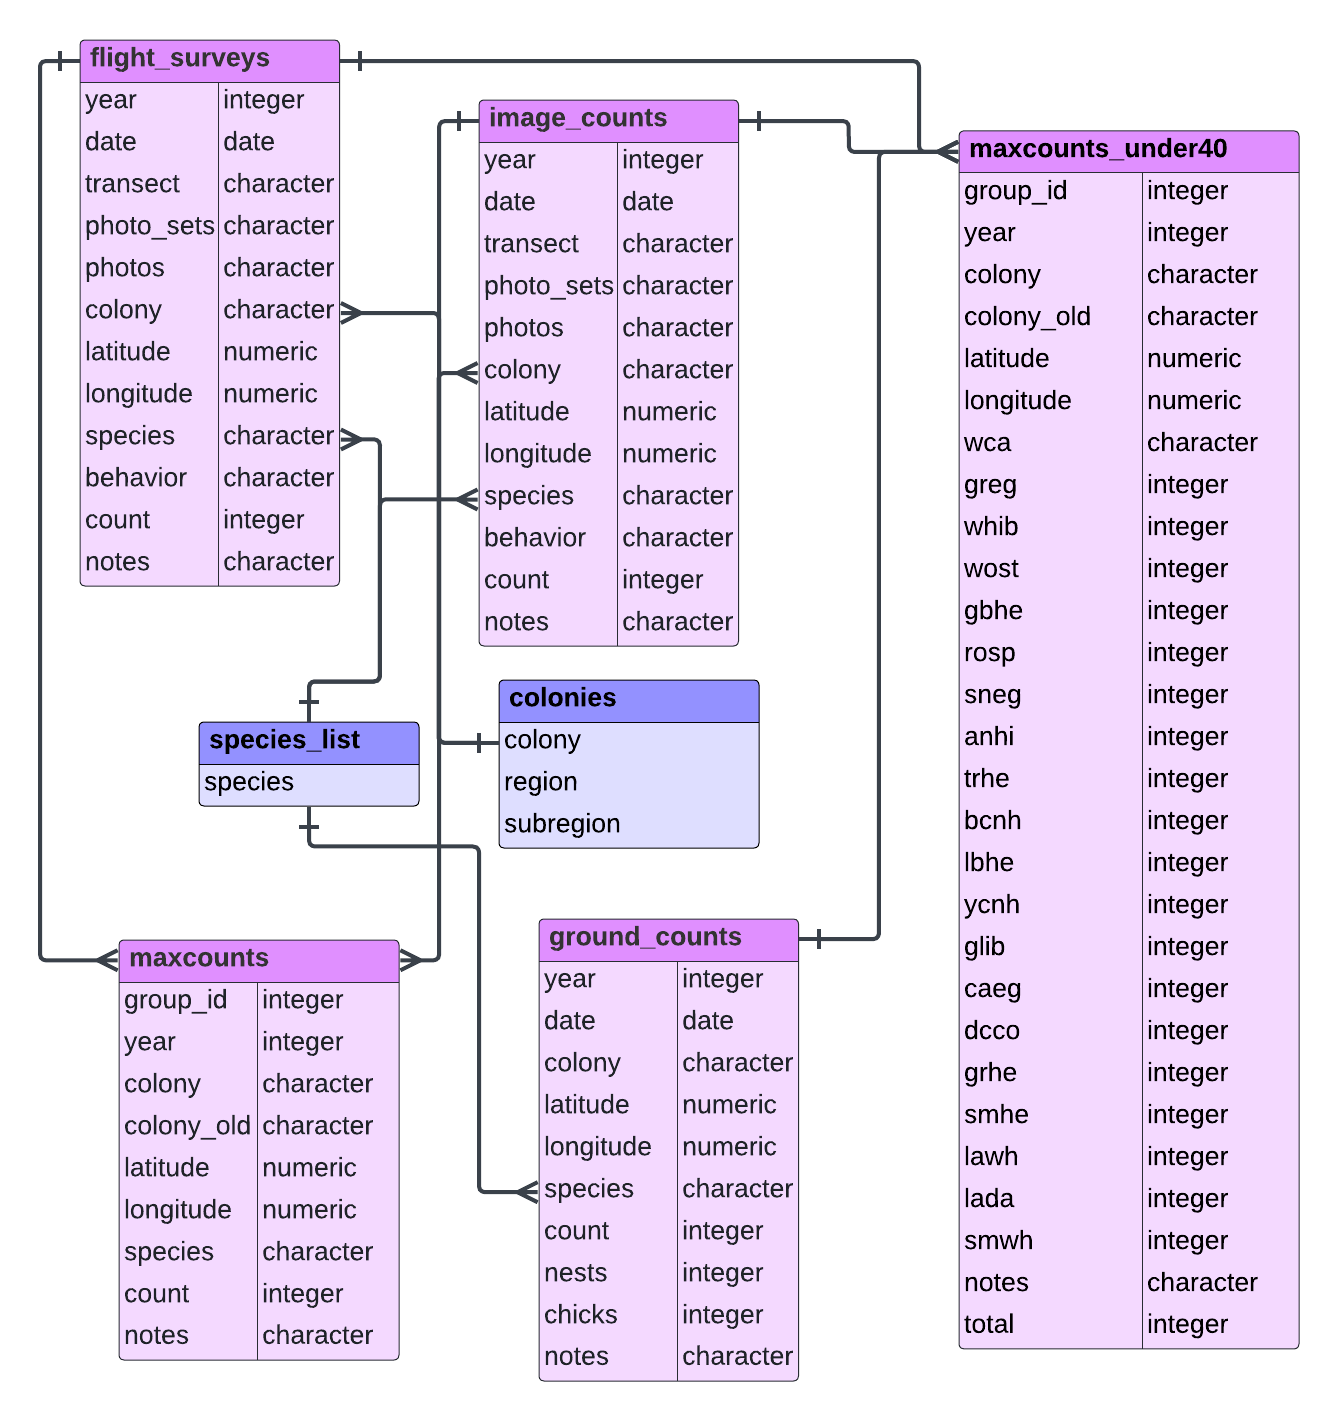
- flight_surveys.csv: Raw counts from the aerial transect surveys, by date, colony, species and behavior. There is typically more than one observation per location, to account for observer error.
- image_counts.csv: Raw counts from photos/slides taken on the aerial transect surveys, by date, colony, species and behavior. There is typically more than one observation per location, to account for observer error. Not all flight surveys resulted in image counts. Use photo set data to link counts across tables.
- ground_counts.csv: Raw counts from the ground transect surveys, by date, location and species. Locations are latitude-longitude as reported, colony name is included when overlapped by transect.
- maxcounts.csv: Maximum reported count by year, colony, and species.
- maxcounts_under40.csv: Reported counts by year, colony, and species for locations with under 40 nests. Locations are latitude-longitude as reported and include ground transect and aerial counts.
Nesting
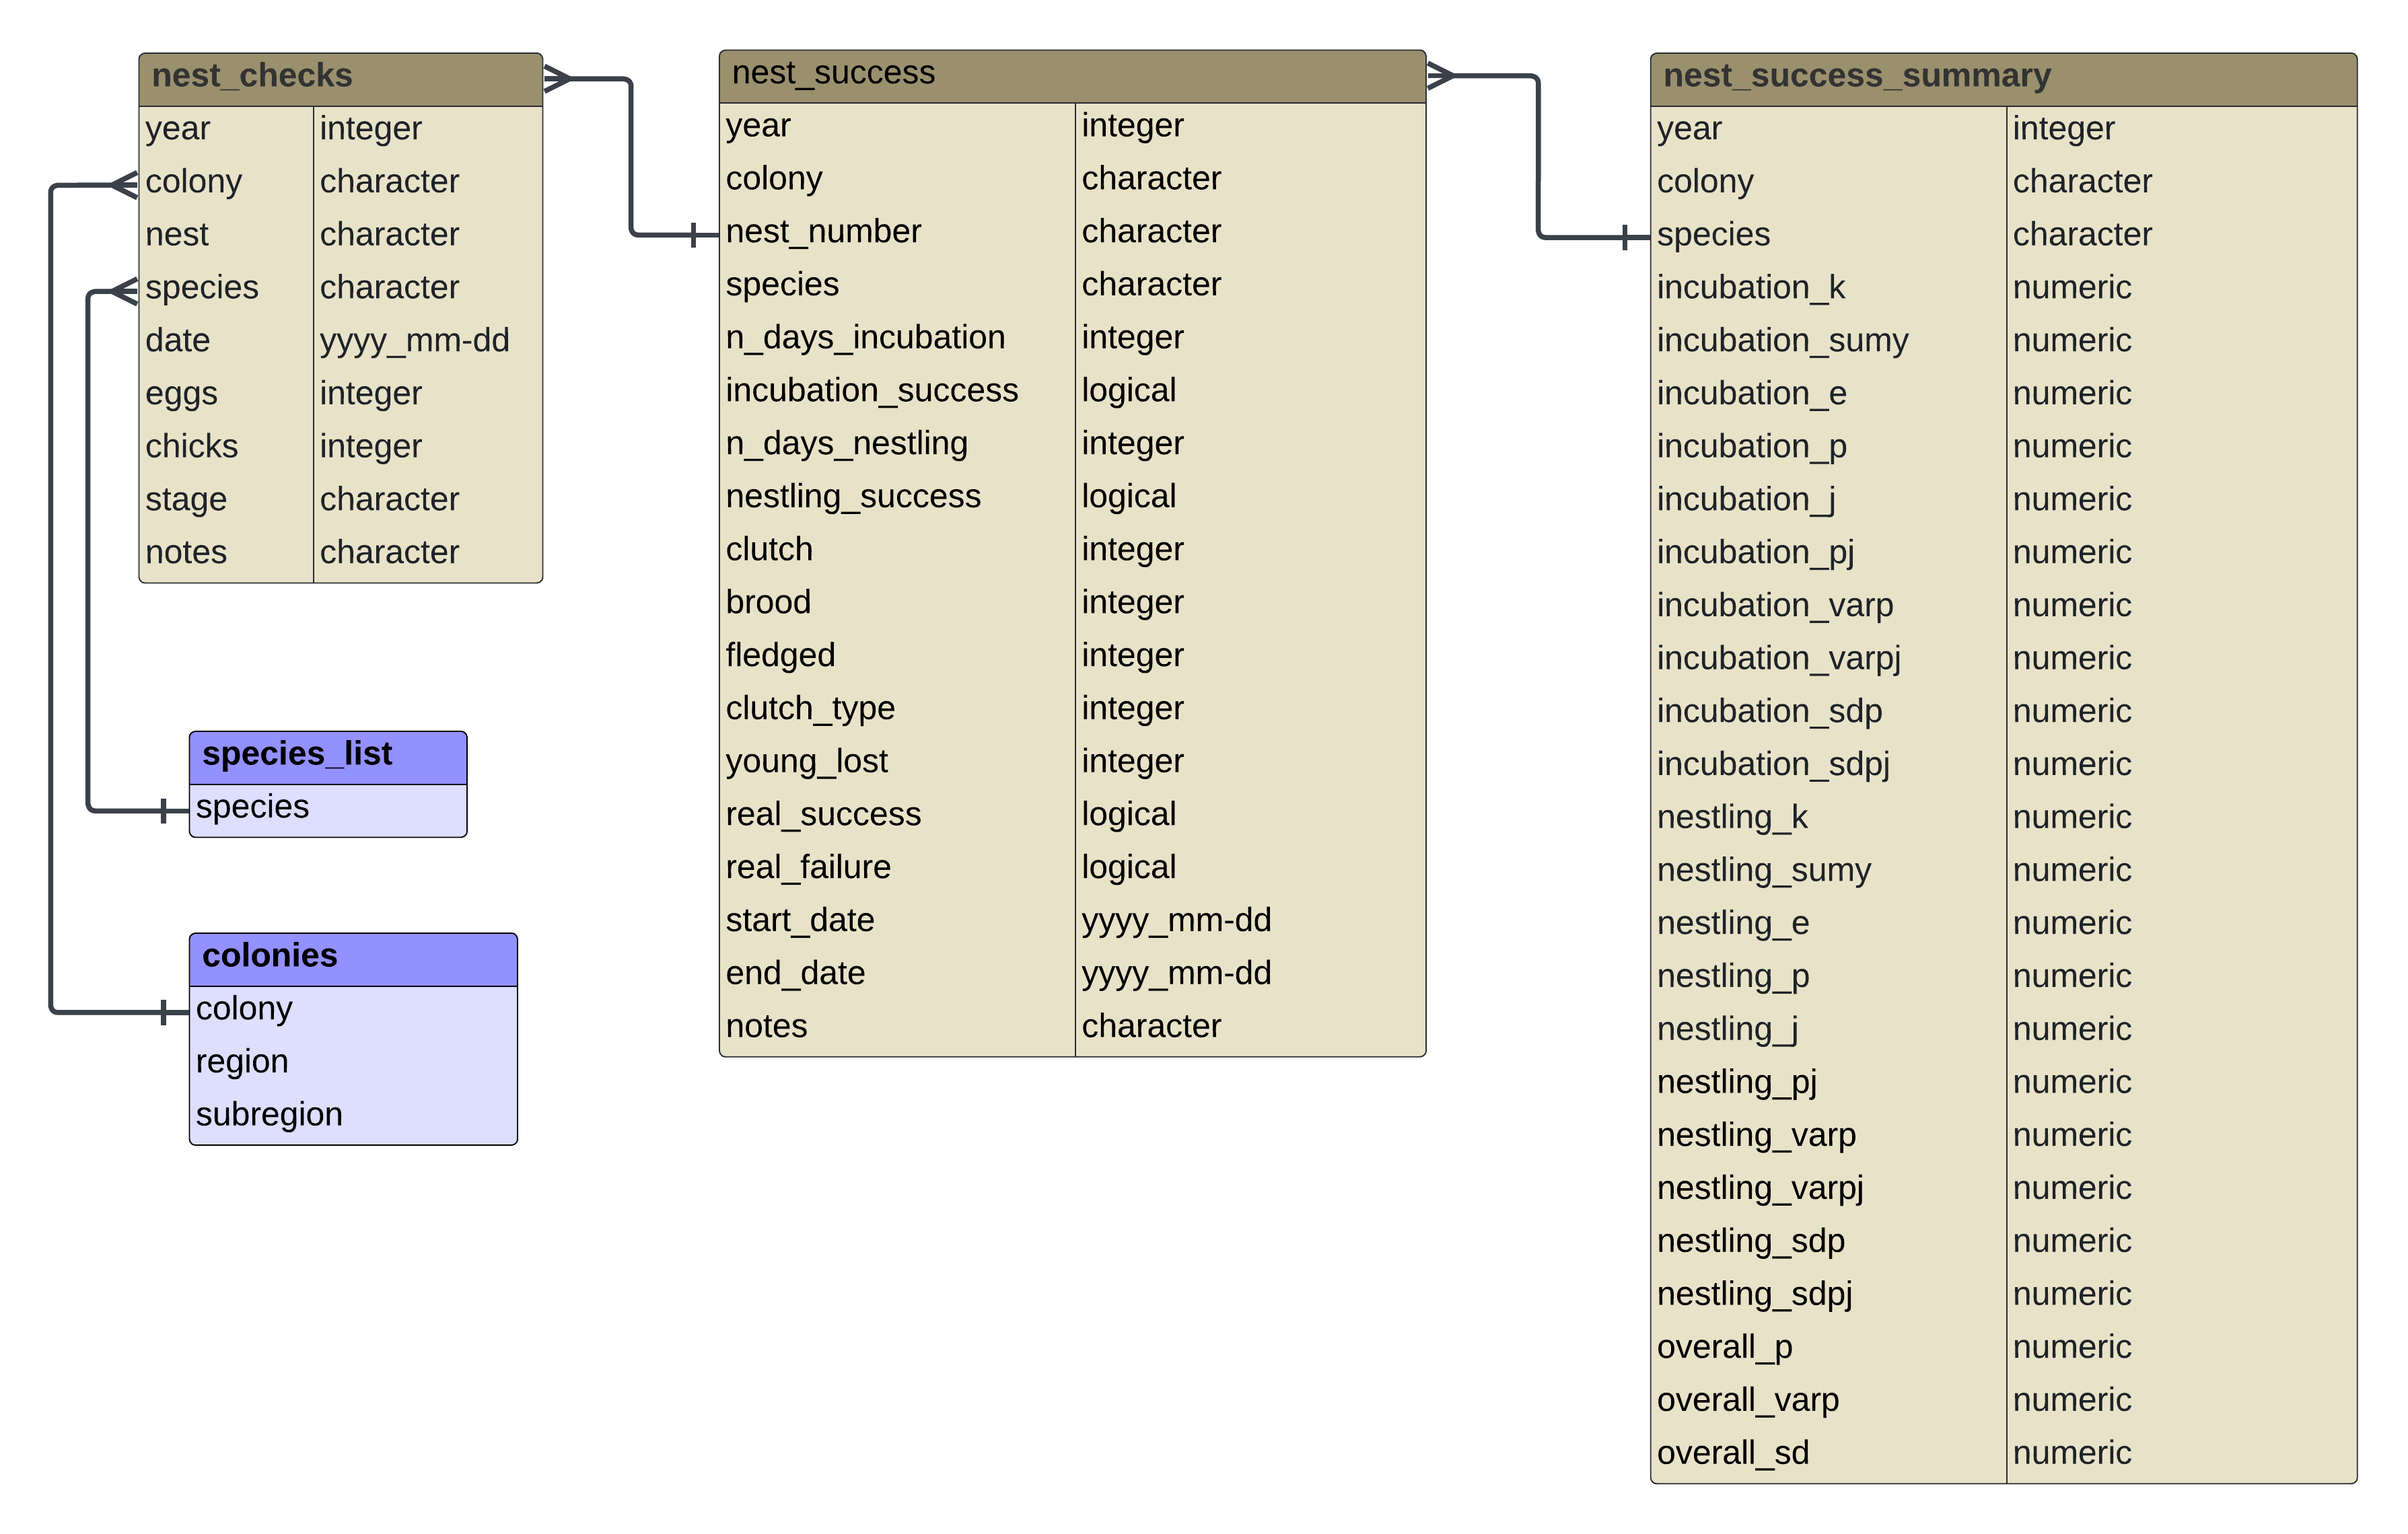
- nest_checks.csv: These are the raw nest check data, used in the nest success calculations. They include date, colony, species, number of eggs/chicks, and nest status.
- nest_success.csv: This is a table of the resulting colony/species-level nest success calculations using the nest check data.
- nest_success_summary.csv: This is colony-level nest success, based on the results from the nest_success table. Success is summarized for the incubation stage, nestling stage, and overall for the whole nesting period.
Hg
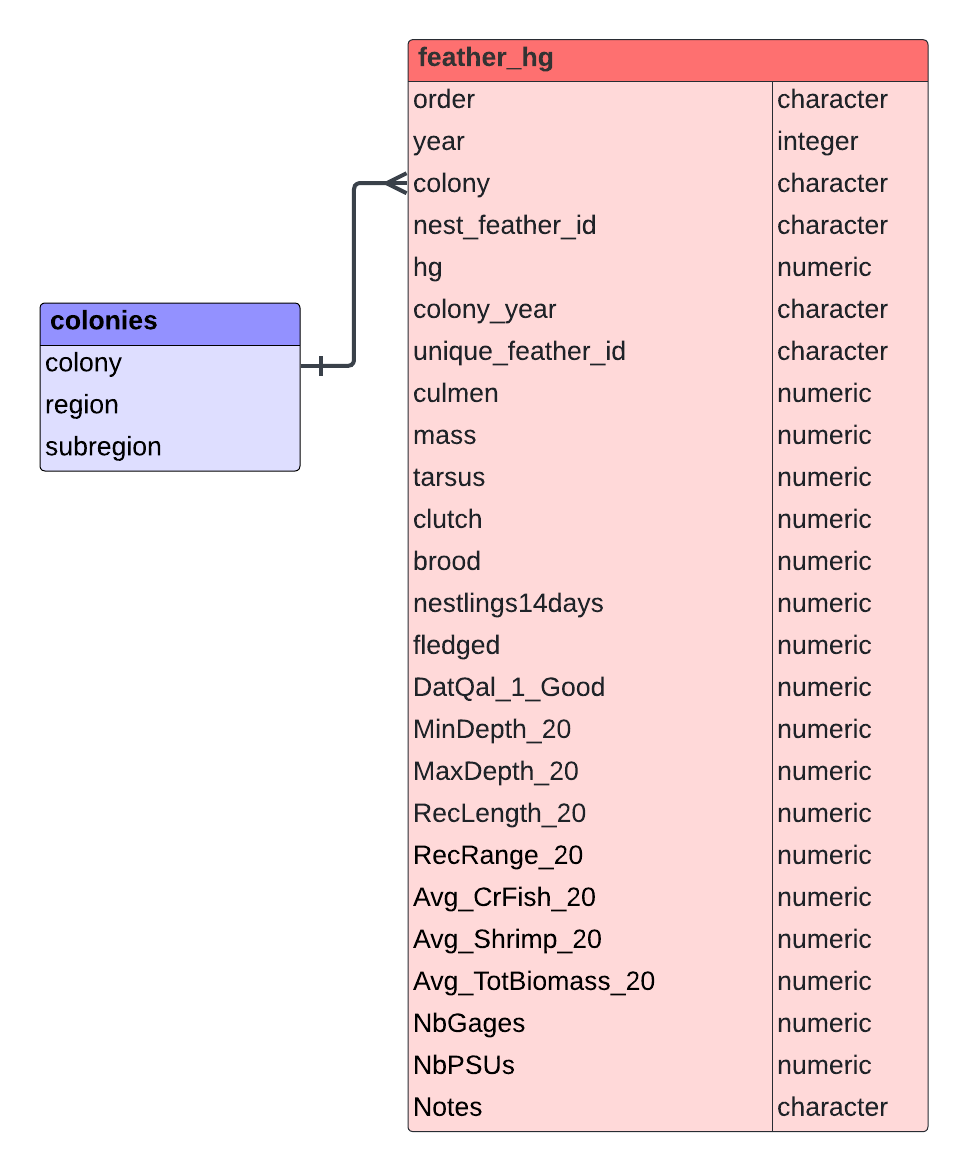
- feather_hg.csv: Measurements for Hg levels in individual feathers.
Indicators
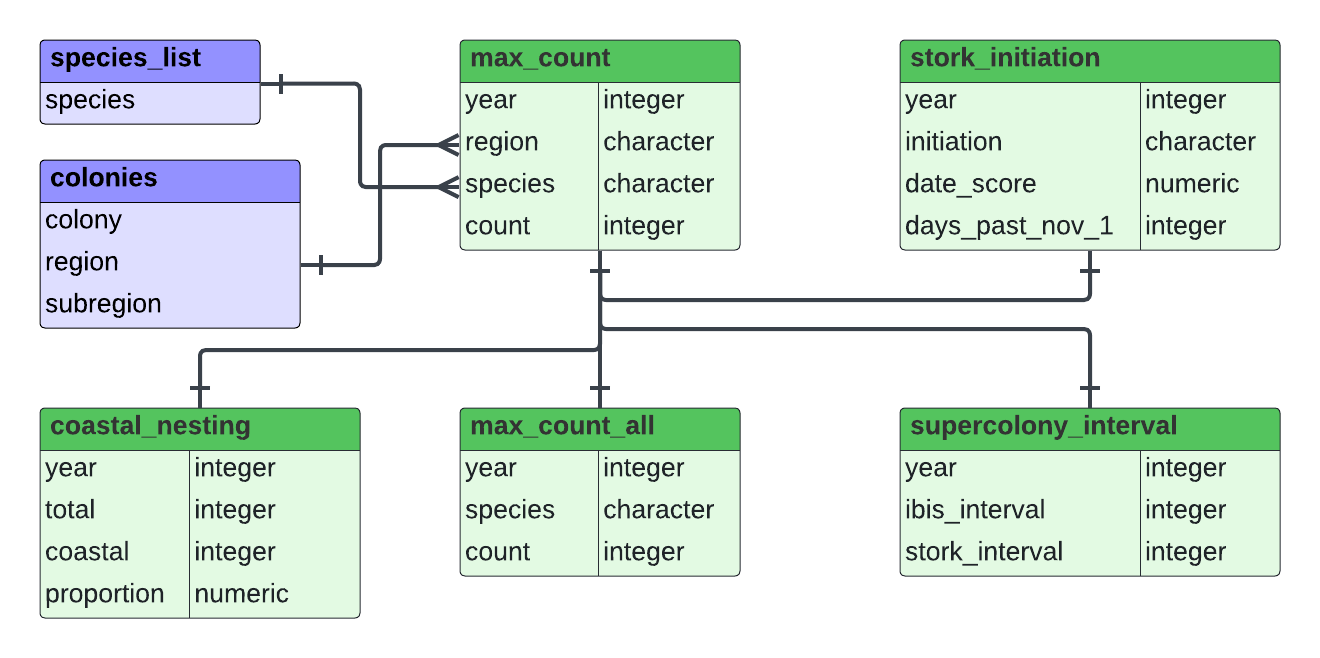
These indicators are used to judge the progress of the Comprehensive Everglades Restoration Plan (CERP) (as well as non-CERP restoration projects) toward achieving restoration goals. Indicators are based on the maximum estimated counts of nesting pairs. These counts are coordinated across groups working in Loxahatchee NWR (aka WCA 1), Water Conservation Areas 2 and 3, and Everglades National Park.
- max_count.csv: These are the yearly reported maximum observed number of nesting pairs. These counts are used to calculate 4 other indicators of restoration progress, including the ratio of tactile/sight foraging species, calculated as (whib + wost)/greg.
- max_count_all.csv: Max_count_all.csv is also provided to record the reported number of nesting pairs across all regions (in most cases, equivalent to sums of numbers in max_count.csv).
- coastal_nesting.csv: Proportion of all species nesting in coastal Everglades National Park colonies, as opposed to the inland Everglades. The data for this calculation only include numbers reported in the South Florida Wading Bird report. Florida Bay is not included.
- stork_initiation.csv: Earliest nesting date for Wood Storks each year, across all colonies. Before 2010, only a month and score were recorded.
- supercolony_interval.csv: Number of years between supercolony events for White Ibis and Wood Storks. The threshold is 16977 for White Ibis, 1458 for Wood Storks. Historic
Historic
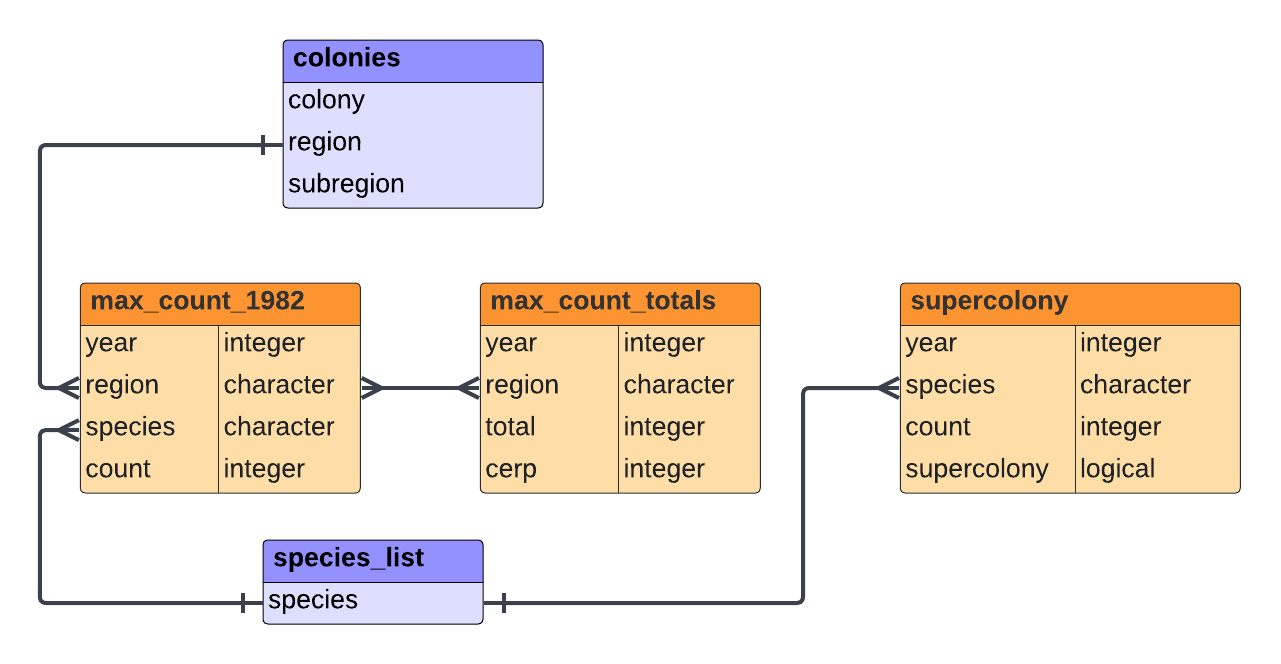
These data are collected from multiple sources in an attempt to extend the time series. This focuses on max counts, which is as consistent as possible with our current time series, and enables us to extend the time series of ecological indicators.
- max_count_1982.csv: Max counts from 1890 - 1982. Some of these are rough estimates.
- max_count_totals.csv: Site-wide reported max counts, beginning in 1890.
- supercolony_interval.csv: Indicator of years in which White Ibis or Wood Storks exceeded the supercolony threshold. Time series beginning in 1912. The threshold is 16977 for White Ibis, 1458 for Wood Storks. Data are from Crozier and Gawlik 2003.
Weather
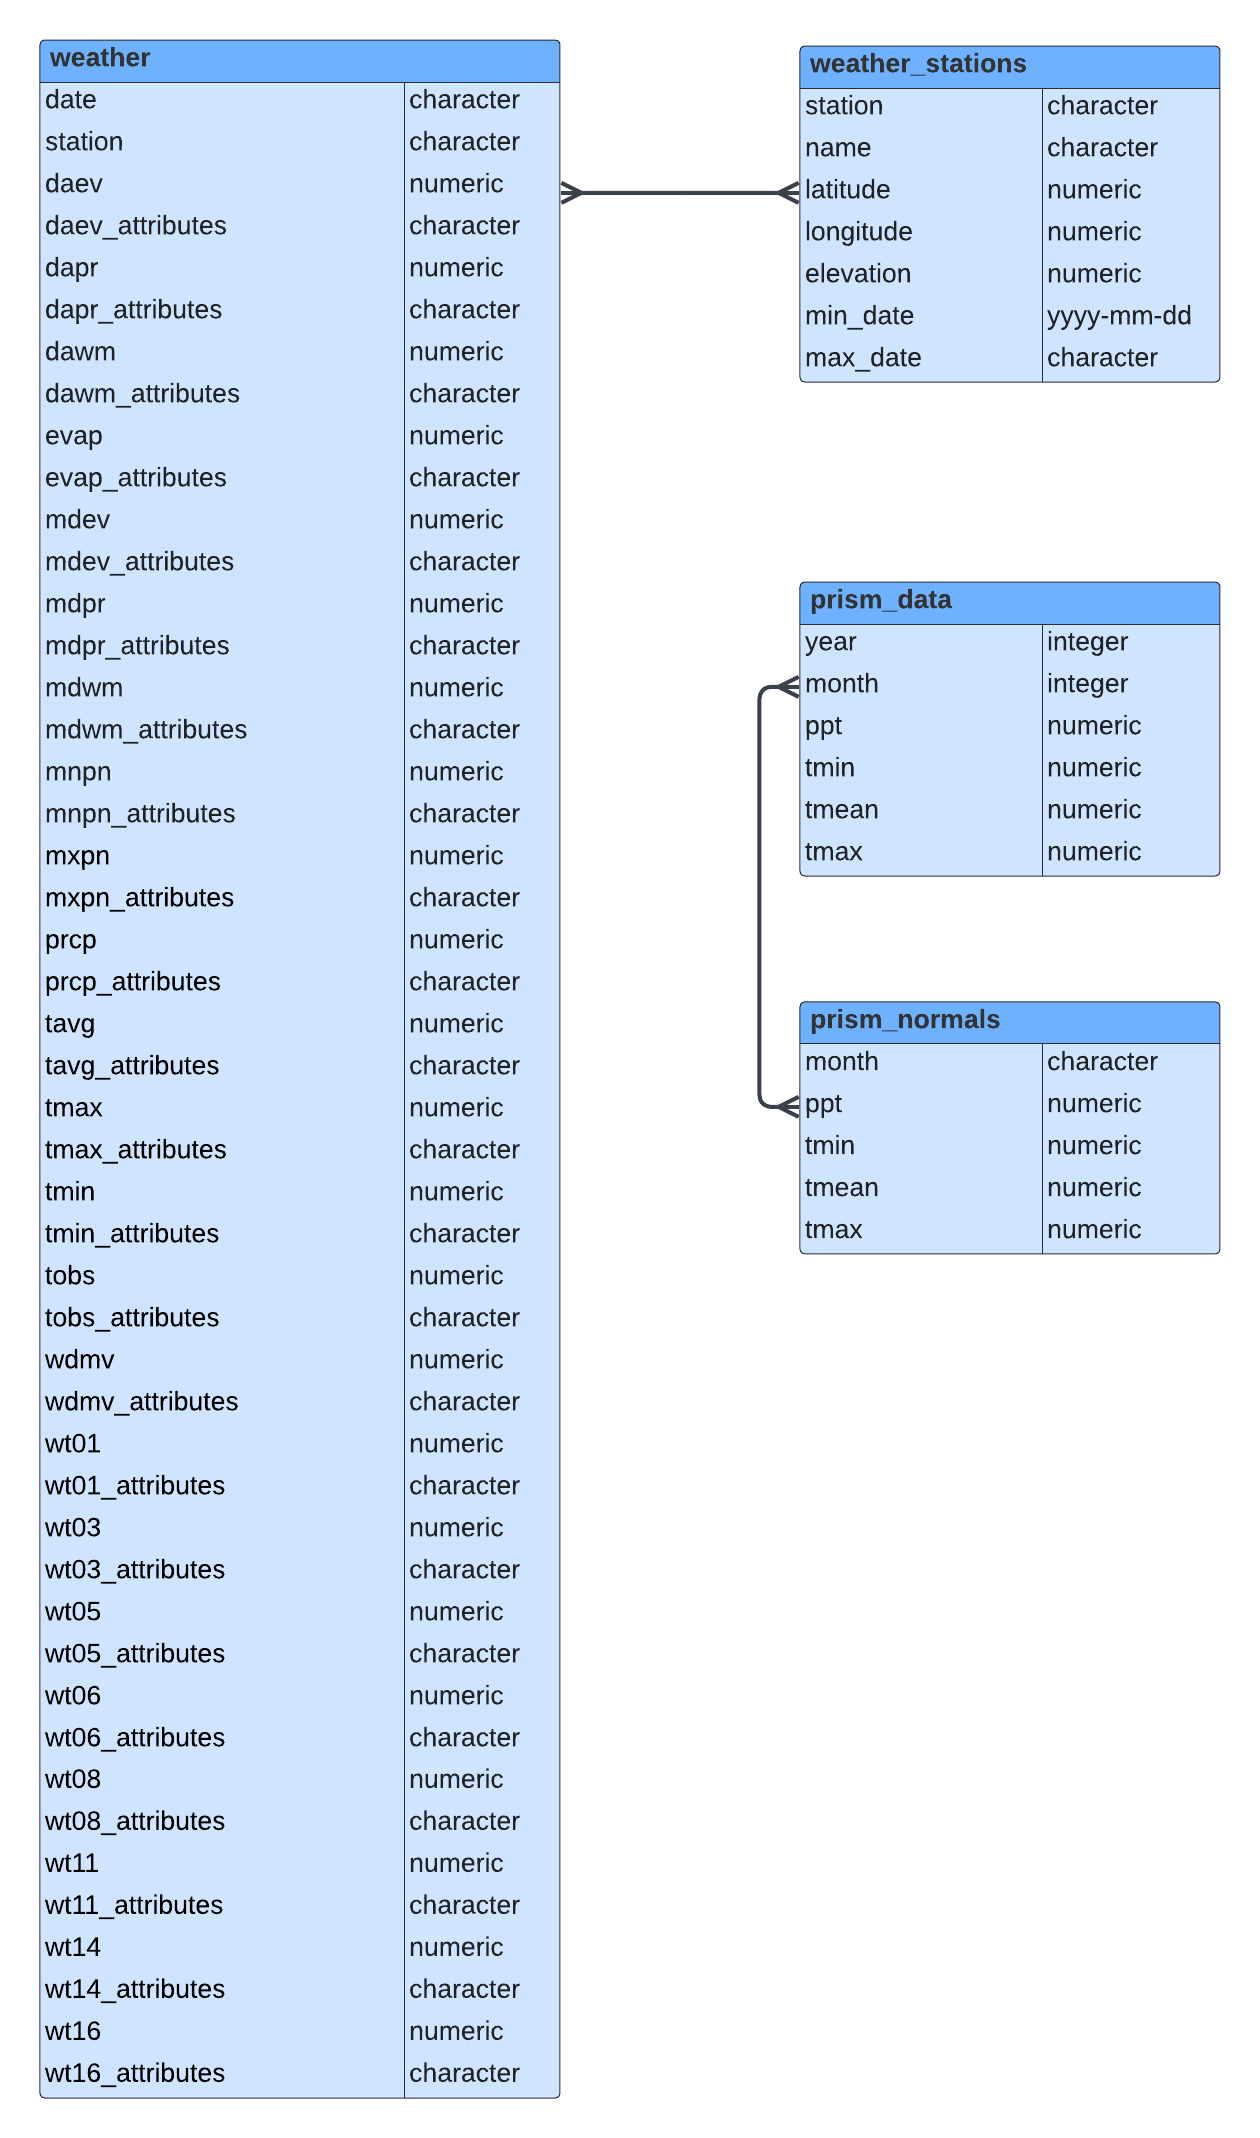
- weather.csv: Daily weather collected from NOAA Custom GHCN-Daily (https://www.ncei.noaa.gov/metadata/geoportal/rest/metadata/item/gov.noaa.ncdc:C00861/html#).
- weather_stations.csv: NOAA Weather station metadata.
- prism_data.csv: PRISM time series data (http://www.prism.oregonstate.edu/documents/PRISM_datasets.pdf).
- prism_normals.csv: Monthly 1991 - 2020 normals calculated from PRISM data.